What the latest adtech earnings cycle reveals about changing economics
The latest financial results suggest the adtech industry is entering a new phase where infrastructure ownership is increasingly shaping growth, profitability and scale
 by
by
Published: May 13, 2026 8:35 AM | 6 min read

- Affle India reported a full-year revenue of INR 27,093 million, marking a 19.5% year-on-year increase, with a five-year EBITDA growth of 30.1% and a revenue CAGR of 25.8%.
- The Trade Desk's Q1 2026 revenue reached $689 million, a 12% increase year-on-year, with guidance suggesting a revenue reacceleration to at least $750 million in Q2 2026.
- PubMatic experienced a 2% decline in headline revenue for Q1 2026, but underlying business growth was 13% year-on-year when excluding the impact of a lost client.
- Criteo reported a 9% decline in Contribution ex-TAC at constant currency, primarily due to two client scope reductions, while both Criteo and The Trade Desk increased capital expenditures significantly to support future growth.
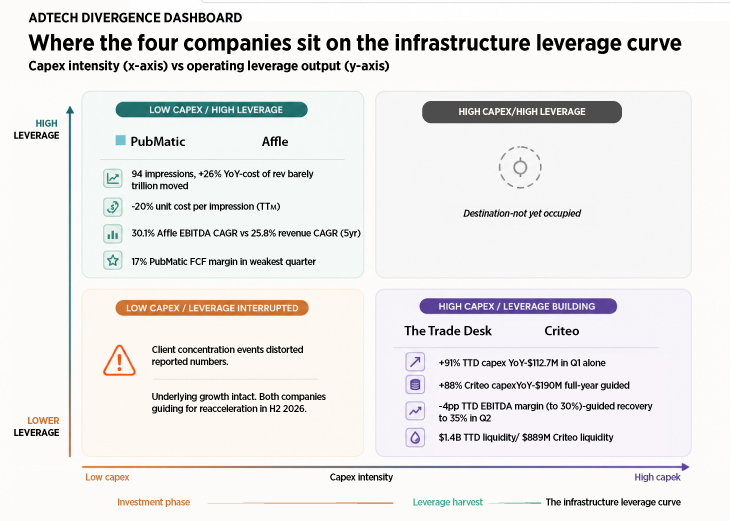
Across Affle, The Trade Desk, PubMatic and Criteo, the earnings numbers from the last reported quarter and the full financial year paint a picture that goes well beyond a standard growth story.
Affle India delivered full-year revenue of INR 27,093 million, up 19.5% year on year, with its five-year EBITDA compounding at 30.1% against a revenue CAGR of 25.8%. The Trade Desk reported Q1 2026 revenue of $689 million, a 12% year-on-year increase, while guiding for $750 million or more in Q2, implying a reacceleration toa approximately 15% growth. PubMatic's headline revenue declined 2% in Q1 2026, but stripped of the impact of a large legacy demand-side platform buyer it lost access to mid-2025, the underlying business grew 13% year on year. Criteo reported a 9% decline in Contribution ex-TAC at constant currency, entirely attributable to two Retail Media client scope reductions worth approximately $27 million in lost contribution.
When Unit Costs Fall as Volume Rises, Something Structural Is Happening
PubMatic processed 94 trilalion advertising impressions in the first quarter of 2026, a 26% increase year on year. Its cost of revenue moved from $25.6 million to $26.1 million over the same period. The arithmetic of that combination, a 26% increase in volume against a cost increase of roughly 2%, produced a 20% reduction in unit cost per impression on a trailing twelve-month basis. PubMatic's owned-infrastructure approach is the mechanism. The result is a company generating a 17% free cash flow margin in what is seasonally the weakest quarter of the advertising calendar, while maintaining 40 consecutive quarters of positive adjusted EBITDA.
Affle's numbers tell a parallel story from the demand side of the programmatic chain. The company's employee cost grew 8.6% in FY2026 against revenue growth of 19.5%. Other operating expenses did not just grow slower than revenue. They fell, declining 2.5% in absolute terms while the business scaled. The five-year trajectory makes the point even more precisely. Revenue compounded at 25.8% annually from FY2022 to FY2026. EBITDA compounded at 30.1%.
What makes Affle's model particularly relevant to the broader industry conversation is its geography. India and Emerging Markets contributed 72.9% of FY2026 revenue, growing at 21.2% year on year in Q4 alone. The company delivered 456 million conversions in FY2026, up from 392.8 million the year before, while the average revenue per conversion, what Affle calls its cost per converted user, rose from INR 57.5 to INR 58.9. Volume and pricing grew simultaneously.
Emerging markets represent an accelerating share of global programmatic inventory, yet the infrastructure investment thesis has historically been articulated almost entirely through a North American and European lens. Affle's five-year CAGR performance, built substantially on India and emerging market conversions, indicates that the operating leverage model is not geographically limited. The programmatic opportunity in markets where mobile-first advertising is the default, not the exception, is large and structurally underpenetrated.
The Capex Surge Is Not a Warning Signal. It Is a Blueprint Being Followed in Sequence
The Trade Desk spent $112.7 million on capital expenditure in Q1 2026 alone, a 91% increase year on year from $59.1 million in Q1 2025. Criteo's Q1 2026 capex of approximately $32 million was up 88% year on year, with full-year guidance pointing to roughly $190 million, primarily directed at data centre renewals. Both companies are absorbing temporary margin pressure as a result. The Trade Desk's adjusted EBITDA margin compressed four percentage points to 30% in Q1 2026, even as free cash flow grew 20% year on year to $276 million. Criteo's adjusted EBITDA of $65 million in Q1 reflected both seasonal softness and the cost of planned growth investment.
The question the market is asking, and that the numbers do not yet fully answer, is whether The Trade Desk's capex cycle represents a single step-up or the start of a structurally higher cost base. The Q2 guidance, which implies revenue of at least $750 million and an EBITDA margin recovery to approximately 35%, suggests the company believes the investment is bounded.
The Trade Desk held approximately $1.4 billion in total liquid assets as of end of Q1 2026, including $878 million in cash and $528 million in short-term investments. It simultaneously returned approximately $164 million to shareholders through buybacks in the quarter, with $327 million remaining under its repurchase authorisation. Criteo reported total liquidity of $889 million with no long-term debt. Affle's balance sheet is perhaps the most striking of all. Total borrowings stood at just INR 119 million as of March 31, 2026, against total equity of INR 36,522 million. Cash and liquid investments of INR 17,921 million represent roughly 40% of total assets.
The New Trend the Numbers Are Starting to Surface
Impression and conversion volume across the industry is growing materially faster than revenue. PubMatic processed 26% more impressions year on year while revenue declined 2% on a reported basis. Affle delivered 16.1% more conversions in FY2026 while growing revenue 19.5%, the inverse case where pricing held and volume grew. The Trade Desk has grown from $114 million in 2015 to $2.896 billion in full-year 2025, a trajectory that required expanding both the volume of transactions and the share of each transaction captured.
The unit cost deflation at PubMatic is the proof of concept. The capex investment at The Trade Desk and Criteo is the thesis being implemented. The CPCU model at Affle, where 99.2% of FY2026 revenue came from guaranteed outcome-based transactions, is a version of the same logic applied at the campaign level rather than the infrastructure level.
There is a related risk that the same results make visible. PubMatic's single large DSP buyer departure created a 15-point gap between headline and underlying growth. Criteo's two Retail Media client scope reductions produced a $27 million headwind that accounted for essentially the full 9-point CexTAC decline at constant currency. In both cases the underlying business was growing. In both cases the market read a decline. The programmatic supply chain routes enormous volumes of spend through a relatively small number of large intermediaries.
The companies that moved early on infrastructure ownership are now demonstrating the financial profile that justifies the thesis. The companies investing now are absorbing temporary margin compression from strong balance sheets while guiding for reacceleration. Criteo, for its part, has guided for a return to growth in Q4 2026 with reacceleration into 2027. The Trade Desk's Q2 guidance implies the margin recovery has already begun. Cash generation across all four companies runs ahead of accounting profit, a consistency that points to earnings quality rather than earnings management.
The global advertising market, estimated at over $1 trillion, continues to shift structurally toward programmatic, outcome-linked, and data-driven buying. The Open Internet alone represents approximately $280 billion of that total. Against that backdrop, the financial architecture these four companies are building, capital-light at maturity, infrastructure-heavy in the investment phase, outcome-linked at the transaction level, and cash-generative throughout, may be the most important story the quarterly numbers are telling.
Read more news about Digital Media, Internet Advertising, Marketing News, Television Media, Radio Media
For more updates, be socially connected with us onInstagram, LinkedIn, Twitter, Facebook, YouTube & Google News