Marketing Initiative

MARKETING INITIATIVE

Latest News


International News


e4m VIDEO


")


MOST READ STORY


GUEST COLUMN


TELEVISION

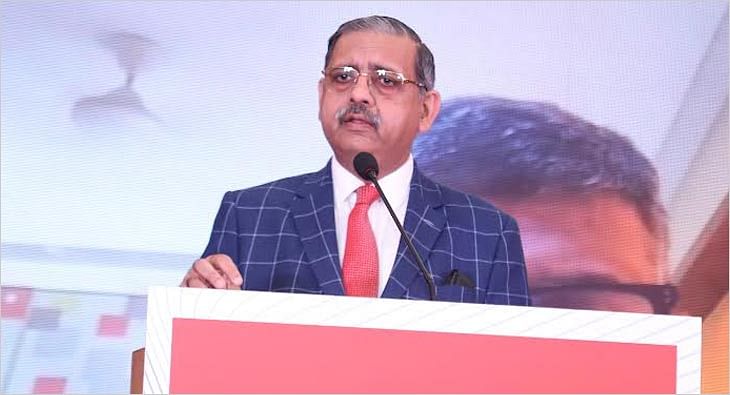
TRAI will finalise National Broadcast Policy by May-end: Anil Kumar Lahoti
Chairman Anil Kumar Lahoti on Thursday said TRAI’s goal is to provide a level playing field to all stakeholders in the industry

DIGITAL
e4m-Teads roundtable today: Experts to explore how CTV is reshaping media
The theme of the roundtable is ‘Navigating the digital tide: How CTV is reshaping media’


OUT OF HOME
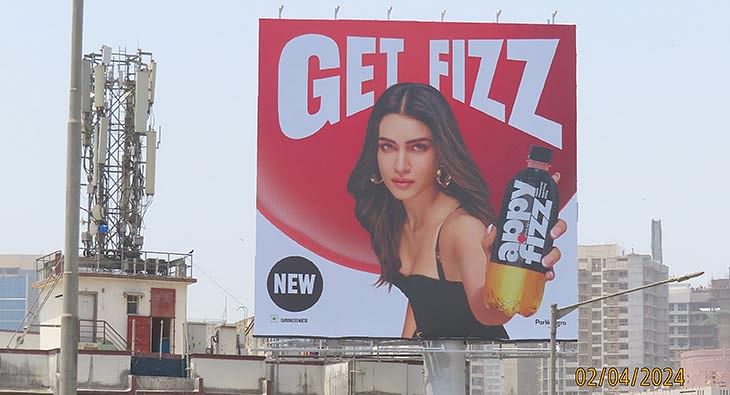
Parle Agro launches OOH campaigns for Appy Fizz, Frooti & Smoodh
Static and digital billboards have been positioned along major roads and intersections, targeting key routes, the company said


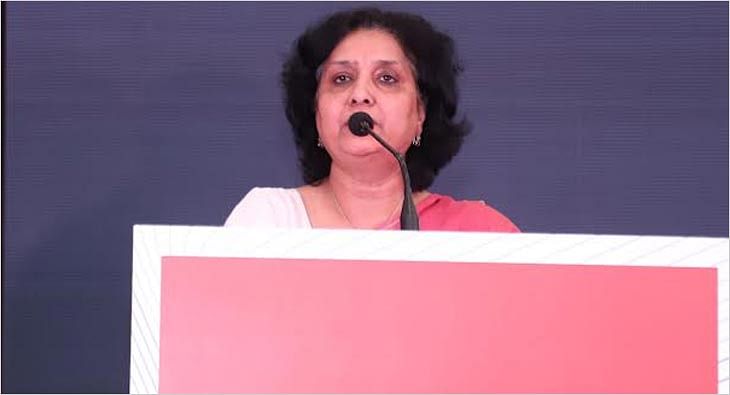
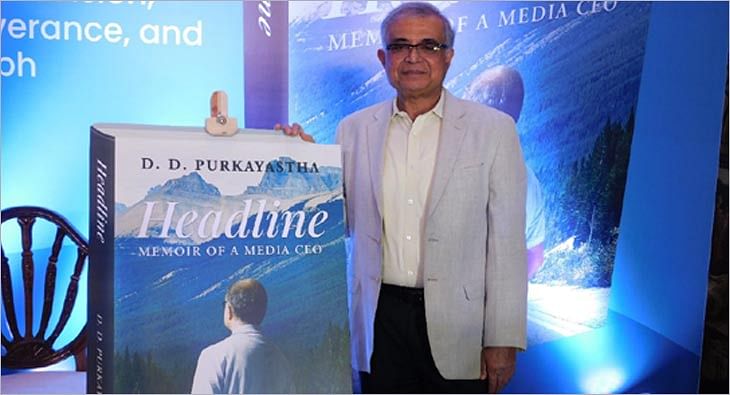
‘Publishers have to discover new revenue streams beyond traditional print subscr...
Anant Nath, President of AIM and Executive Publisher of Delhi Press, spoke to e4m on the upcoming edition of the Indian Magazine Congress, the issue of monetisation and much more

RADIO

Radio recovers just 73% of pre-Covid numbers: What's slowing the comeback?
Experts cite lack of measurement, lower ad rates and strong competition from OTT platforms as some of the factors muting the growth